
Introduction: A quick scene, a stat, a question
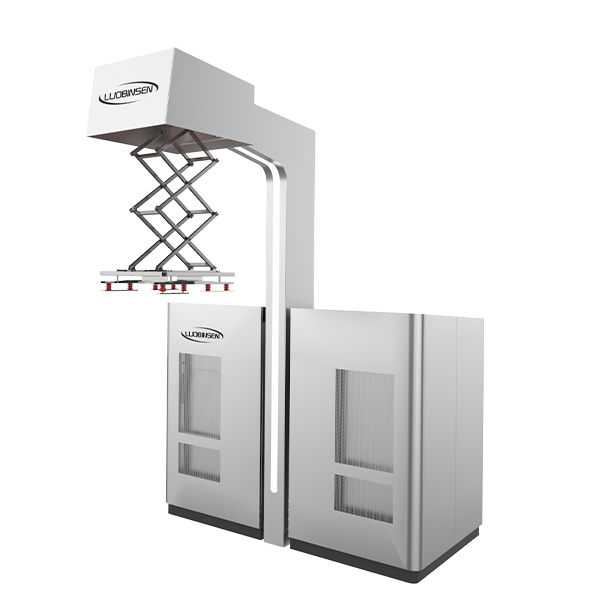
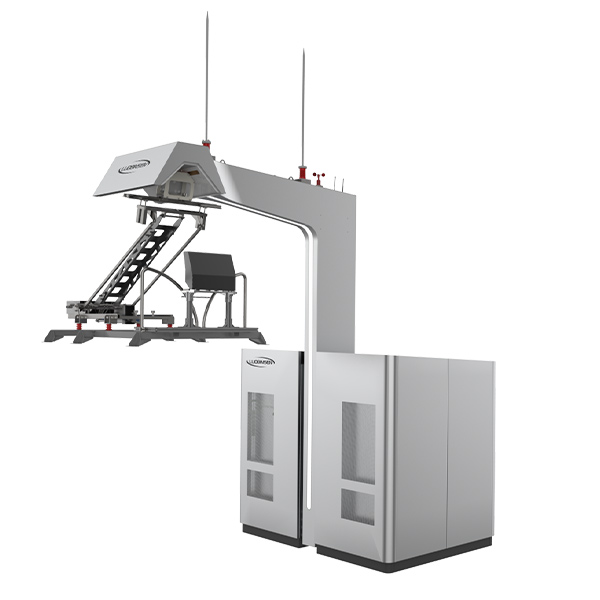
I was at the depot last week watching a bus line shuffle through a charging bay — classic rush hour graft, right? In the next breath, one of the chargers tripped and a handful of services ran late. The piece in question was a pantograph charger, the gear that lifts and connects to the bus roof. (You know the drill: quick connect, high current.)
Data tells us downtime costs operators serious money — a single hour of lost service can ripple into lots of unhappy passengers and extra running costs. So I ask: how do we stop avoidable faults and keep chargers humming? I’ve worked on these systems, tinkered with power converters, and seen where small fixes deliver big wins. Let’s walk through some practical steps that matter and why they do.
Next, I’ll dig into what’s really failing out there — not just the obvious bits — and then we’ll look ahead at tech that helps. Stick with me; I’ll keep it plain and useful.
Part 2 — What’s really going wrong with pantograph ev charging?
When I say pantograph ev charging, most folks picture the arm and the bus meeting up. But the real trouble often lives deeper: ageing control algorithms, inconsistent contact pressure, and poor thermal management. These are things you don’t spot on a quick walk-around. I’ve seen systems where the contact wear was masked by software that deferred alarms — and that’s the rub.
Why do these faults slip through?
First, many operators rely on legacy control logic built for lower currents and fewer cycles. Modern urban fleets run fast turnarounds and higher duty cycles. Second, maintenance regimes focus on visible wear — plates and pantograph heads — but ignore the DC bus health, insulation resistance, and the subtle rise in contact resistance. Look, it’s simpler than you think: small resistance rises mean heat, heat means quicker wear and occasional arcing. Add in flaky sensors and you’ve got intermittent faults that are maddening to debug.
I’ll be blunt — training gaps make it worse. Techs often know mechanical checks but not how to read thermal imaging logs or interpret power quality metrics. And because operators usually track uptime at a high level, they miss short, recurring micro-outages that presage bigger failures. So we need to shift monitoring and maintenance to a finer grain: edge diagnostics, contact force profiling, and predictive alarm thresholds. — funny how that works, right?
Part 3 — Looking ahead: principles and practical metrics for better systems
So where to from here? I favour two tracks: adopt smarter monitoring principles and choose hardware that tolerates real-world abuse. Newer systems combine rapid telemetry, adaptive control, and improved mechanical designs to cut faults and speed recovery. A modern pantograph charging system will give you per-connection logs, real-time contact resistance, and thermal maps. I’ve seen these changes halve downtime in some pilots — and that wasn’t magic, just a clear plan and steady work.
What’s next for operators?
Pick upgrades that target the weak spots we talked about: better control algorithms, upgraded power converters, and sensors that speak plainly to your maintenance crew. Train your teams to use the data — not just glance at it. I’d also prototype rolling replacements rather than one-off fixes; that smooths budgets and reduces risk. — and you learn faster with smaller steps.
To finish, here are three practical metrics I use when evaluating systems: 1) Mean time between contact failures (MTBCF) — measures mechanical reliability under load; 2) Percentage of connections with rising contact resistance over 90 days — a leading indicator; 3) Time-to-detect-and-recover for micro-outages — shows how fast your ops can respond. Use those, and you’ll see clear progress.
I’m biased towards solutions that give clear logs and keep crews informed. If you want a supplier who understands these trade-offs, check out Luobisnen. I’ve worked alongside teams using their gear — real improvements, not just marketing lines.